PCHA
2025-05-06
pcha.RmdOverview of PCHA implemented in Rust
1. Problem set-up
| symbol | shape | meaning | ||
|---|---|---|---|---|
| variables × samples | raw data | |||
| (I=n_I) | dictionary columns (“atoms”) | |||
| (U=n_U) | columns to be approximated | |||
| — | number of archetypes (components) |
We split and seek
with the convex-hull constraints
The sum-of-squares error (SSE) to minimise is
2. Algebra that drives the code
-
Expand (1)
Two cached Gram matrices therefore appear everywhere in the Rust code
-
Gradients
(These two lines are the heart of
s_updateandc_update.) -
Projected–gradient step
Take a gradient step: for .
-
Project back to the feasible set. Each column is sent onto the probability simplex
$$ \Delta^{m-1}:=\Bigl\{\,z\in\mathbb{R}^m_{\ge 0}: \langle\mathbf 1,z\rangle=1\Bigr\}, $$
using the Wang–Carreira-Perpiñán algorithm (O(m log m)), implemented in
project_simplex. Armijo-type line-search If the new SSE is not smaller, shrink ; else accept and enlarge . (see the inner
while !stoploops).
-
Optional “α-relaxation’’ To let each archetype deviate slightly from exact $ _1! =!1$, a per-column scalar is fitted (second part of
c_update). In formulas: minimise w.r.t.
3. Initialisation
-
Furthest-Sum (FS) finds columns of that are mutually far apart in Euclidean distance:
choose seed  i₁
repeat
      pick   i_{t+1} := argmax_j Σ_{s≤t} ‖x_{i_s}-x_j‖
FS provides an indicator matrix with exact simplex columns (one “1” each).
Dirichlet-type random Each column is drawn i.i.d. from ⇒ uniform over the simplex.
Create a data set with a known archetypal structure
library(rustytools)
### Toy data with a known archetypal structure
set.seed(42)
p  <- 60            # genes
n  <- 300           # cells
k0 <- 5             # ground-truth archetypes

# 1. ground-truth archetype matrix A (p × k0)
A <- matrix(rexp(p * k0, 1), p, k0)
# 2. sample coefficients S on the simplex
alpha <- matrix(rexp(k0 * n, 1), k0, n)
S     <- sweep(alpha, 2, colSums(alpha), "/")
# 3. generate data with small noise
X <- A %*% S + matrix(rgamma(p * n, shape = 1, rate = 50), p, n)
Finding optimal number of archetypes
First we set a number of k to iterate through. Using the future
library we can perform pcha on each k in parallel. We normalize the sum
squared error, then use the find_knee_pt function to find
the optimal number of archetypes which is our ground truth archetype
from above
ks <- 1:10
sse <- sapply(ks, function(k) pcha(X, k)$sse)
norm_sse  <- sse / sum(X * X)
kp   <- find_knee_pt(norm_sse, ks, make_plot = TRUE)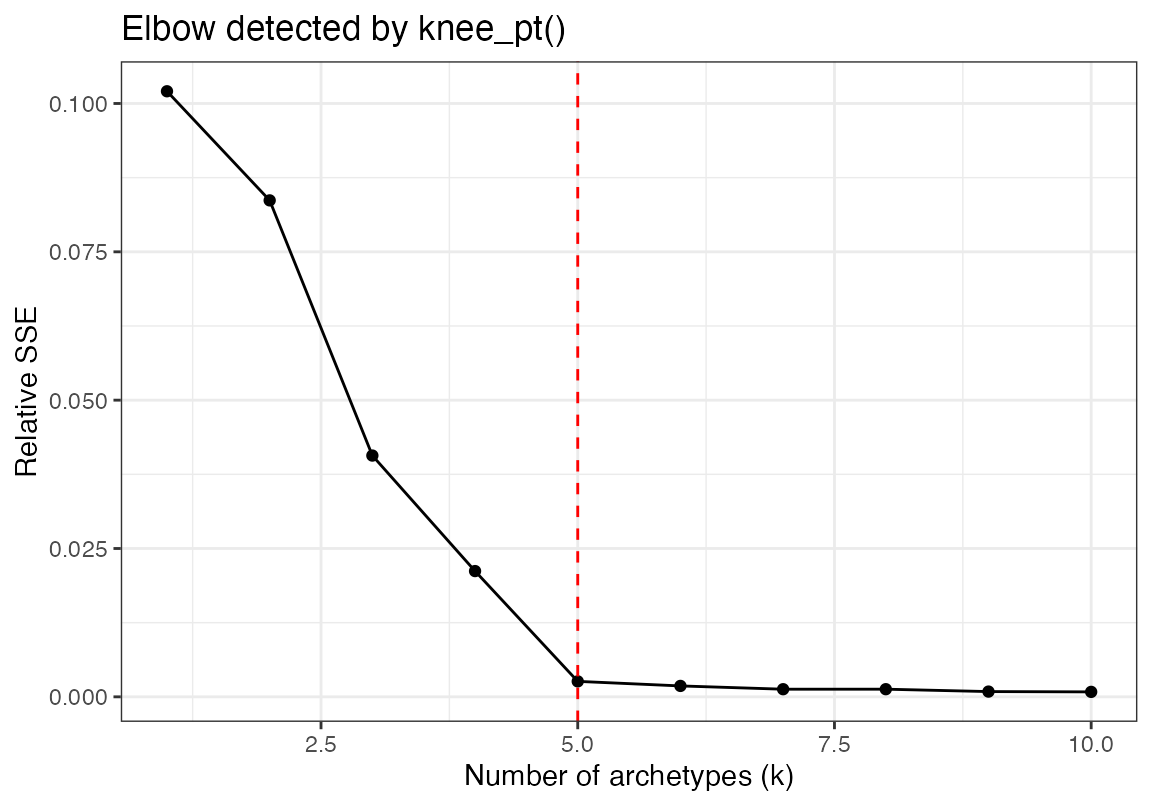
cat("Optimal number of archetypes =", kp$knee_x, "\n")## Optimal number of archetypes = 5What does this look like in single cell RNA sequencing data
First subset out the tumor
library(Seurat)
library(ggplot2)
library(scCustomize)
library(magrittr)

seu <- readRDS("~/Fred Hutch Cancer Center/Furlan_Lab - General/experiments/patient_marrows/annon/AML101/aml101.cds")
DimPlot(seu, group.by = "seurat_clusters")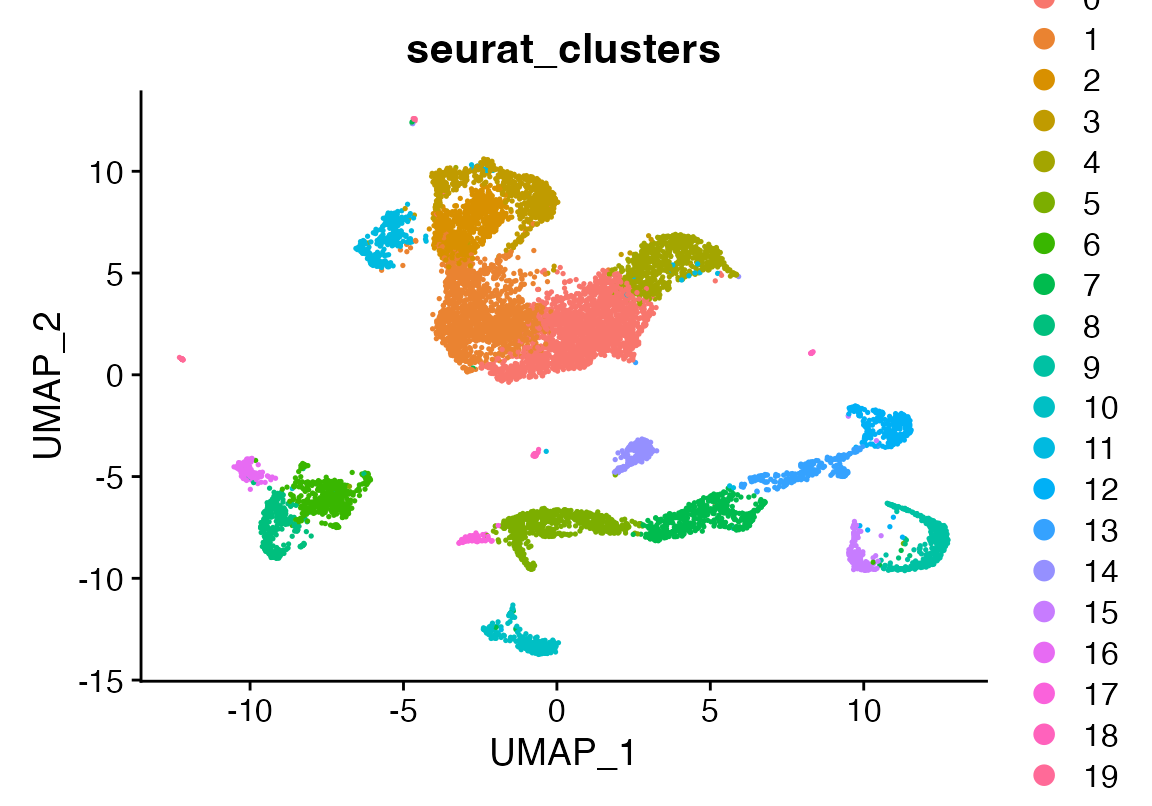
DimPlot(seu, group.by = "geno")
seu$sb <- seu$geno %in% "0" & seu$seurat_clusters %in% c("0", "1", "2", "3", "4", "11")
seu <- seu[,seu$sb]
seu <- NormalizeData(seu, verbose = F) %>% ScaleData(verbose = F) %>% FindVariableFeatures(verbose = F) %>% RunPCA(npcs = 100, verbose = F)
ElbowPlot(seu, ndims = 100)
seu <- FindNeighbors(seu, dims = 1:35, verbose = F) %>% FindClusters(verbose = F) %>% RunUMAP(dims = 1:35, n.epochs = 500, verbose = F)
DimPlot(seu)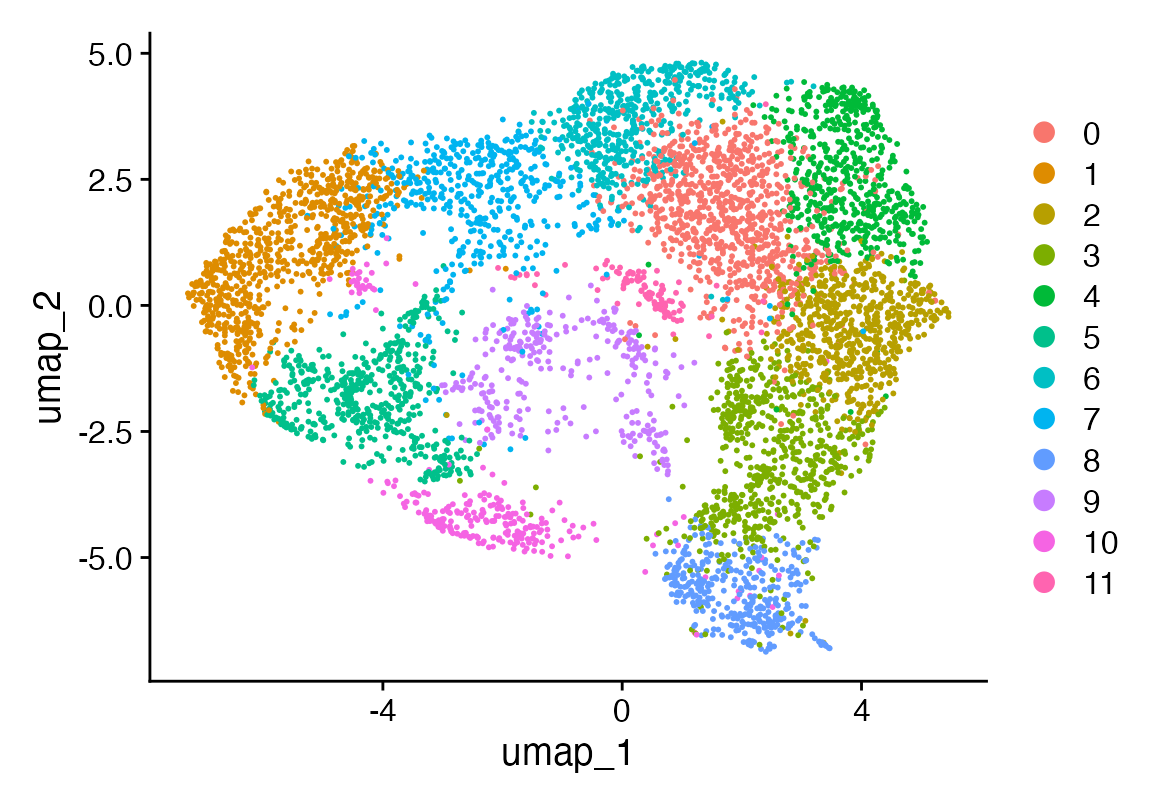
Use some magic.
seu <- seurat_magic(seu, alpha = 1)
DefaultAssay(seu) <- "MAGIC"
seu <- NormalizeData(seu, assay = "MAGIC") %>% ScaleData(verbose = F) %>% FindVariableFeatures(nfeatures = 5000, assay = "MAGIC", verbose = F) %>%  RunPCA(assay = "MAGIC", npcs = 100, verbose = F)
Find nuber of PCs that correspond to 85% of variance
# pull out the per‐PC standard deviations (as before)
sdev <- seu@reductions$pca@stdev

# compute the % variance explained by each PC
explained_var <- sdev^2 / sum(sdev^2)

# cumulative sum
cum_var <- cumsum(explained_var)

# find the first PC where cumulative ≥ 0.85
pct_cutoff <- 0.85
n_pc_85 <- which(cum_var >= pct_cutoff)[1]

message("Using ", n_pc_85, " PCs, which explain ",
        round(100 * cum_var[n_pc_85], 1), "% of variance.\n")

# now subset your cell×PC matrix
pcs_85 <- Embeddings(seu, "pca")[, 1:n_pc_85, drop = FALSE]

seu <- FindNeighbors(seu, dims = 1:n_pc_85, verbose = F, k.param = 5) %>% FindClusters(verbose = F) %>% RunUMAP(dims = 1:n_pc_85, n.epochs = 500, verbose = F)
DimPlot(seu, reduction = "umap")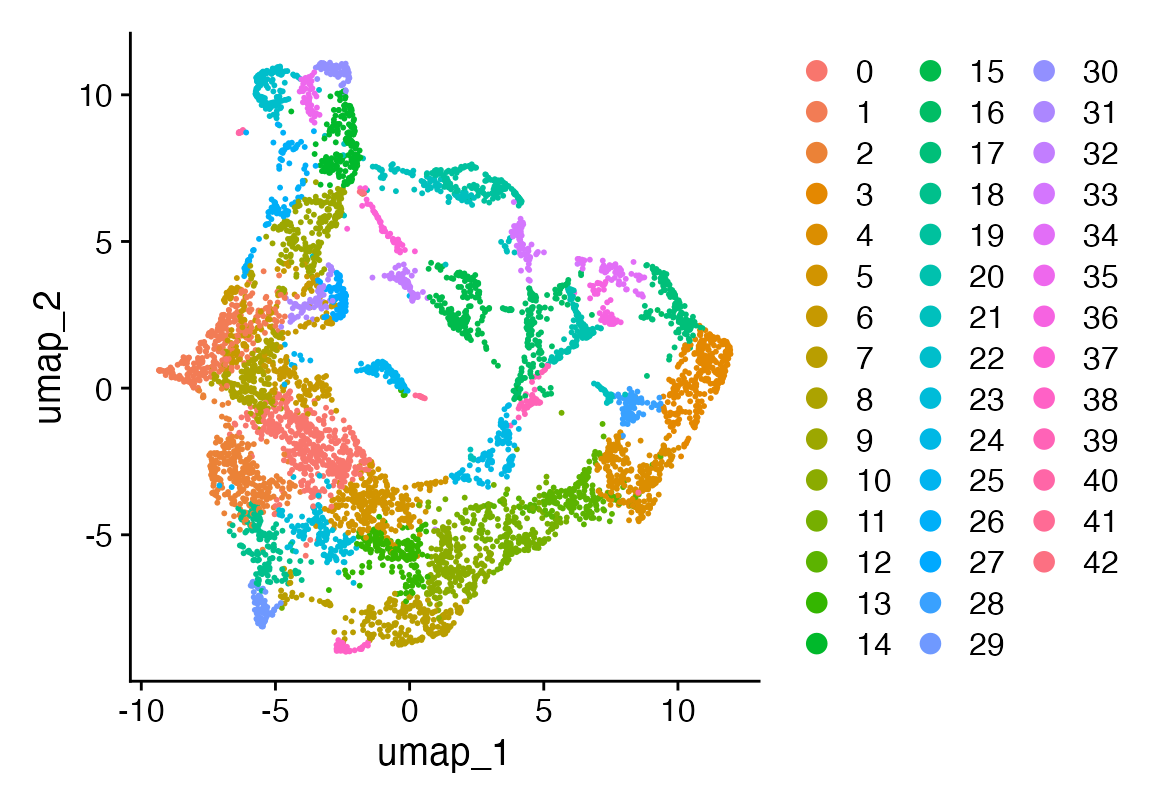
Reproducibility
To ensure reproducibility we can pass random starts to the rust pcha implementation from R. Note that this is not necessary to do in normal practice. Because slightly different solutions may be found with each run of pcha given the random starts, using R to generate random starts is one way to ensure reproducibility. However, the random starts produced in Rust are adequate for most purposes. One suggestion would be to calculate multiple solutions using Rust random starts and use a consensus solution.
set.seed(123)

# ---- 1. implement furthest_sum in R, this is done in the Rust implementation natively ----
furthest_sum <- function(X, k, seed = NULL){
  # X: p×n data matrix (genes × cells), but we only care about columns here
  n <- ncol(X)
  # precompute squared norms
  norms2 <- colSums(X^2)
  # pick initial seed at random if not provided
  if (is.null(seed)) seed <- sample.int(n, 1)
  archetypes <- integer(k)
  archetypes[1] <- seed
  # maintain a running "sum of distances" for each column
  sum_dists <- numeric(n)
  picked <- logical(n)
  picked[seed] <- TRUE

  for (j in 2:k) {
    last <- archetypes[j - 1]
    # distances from last seed to all columns: sqrt(||x_i||^2 + ||x_last||^2 - 2 x_i·x_last)
    # we only need the sqrt to compare, but sum of sqrt is monotonic so we'll do it exactly:
    dots <- crossprod(X[, last], X)    # 1×n vector of dot products
    d2   <- norms2 + norms2[last] - 2 * as.numeric(dots)
    sum_dists[!picked] <- sum_dists[!picked] + sqrt(d2[!picked])
    # pick the column with max cumulative distance
    next_seed <- which.max(ifelse(picked, -Inf, sum_dists))
    archetypes[j] <- next_seed
    picked[next_seed] <- TRUE
  }
  archetypes
}


# ---- 2. build C0 and S0 ----
make_pcha_starts <- function(X, k, rng_seed = 1234, s_rng_seed = 5678){
  set.seed(rng_seed)
  seeds <- furthest_sum(X, k)
  # C0: n×k (because Rust's ni = #columns of X)
  C0 <- matrix(0, nrow = ncol(X), ncol = k)
  for (j in seq_len(k)) C0[seeds[j], j] <- 1

  # S0: k×n uniform → normalized columns
  set.seed(s_rng_seed)
  S0 <- matrix(runif(k * ncol(X)), nrow = k, ncol = ncol(X))
  S0 <- sweep(S0, 2, colSums(S0), "/")

  list(C0 = C0, S0 = S0)
}

kmax <- 15
ks  <- 1:kmax
starts <- lapply(ks, function(k){
  make_pcha_starts(X, k,
                   rng_seed   = 1000 + k,
                   s_rng_seed = 2000 + k)
})

sse  <- sapply(seq_along(ks), function(i){
  k  <- ks[i]
  C0 <- starts[[i]]$C0
  S0 <- starts[[i]]$S0
  message("running PCHA for k=", k, " …")
  pcha(X, k, c_init = C0, s_init = S0)$sse
})

norm_sse  <- sse / sum(X * X)
kp   <- find_knee_pt(norm_sse, ks, make_plot = TRUE)
cat("Optimal number of archetypes =", kp$knee_x, "\n")## Optimal number of archetypes = 3
noc <- kp$knee_x
res <- pcha(X, noc)
weights_df <- as.data.frame(t(res$S))     # cells × k
colnames(weights_df) <- paste0("arch", seq_len(noc))


# a single label: archetype with the largest weight
seu$max_arch <- factor(
  apply(weights_df, 1L, which.max),
  levels = seq_len(noc),
  labels = paste0("Arch", seq_len(noc))
)

DimPlot(seu, reduction = "umap", group.by = "max_arch")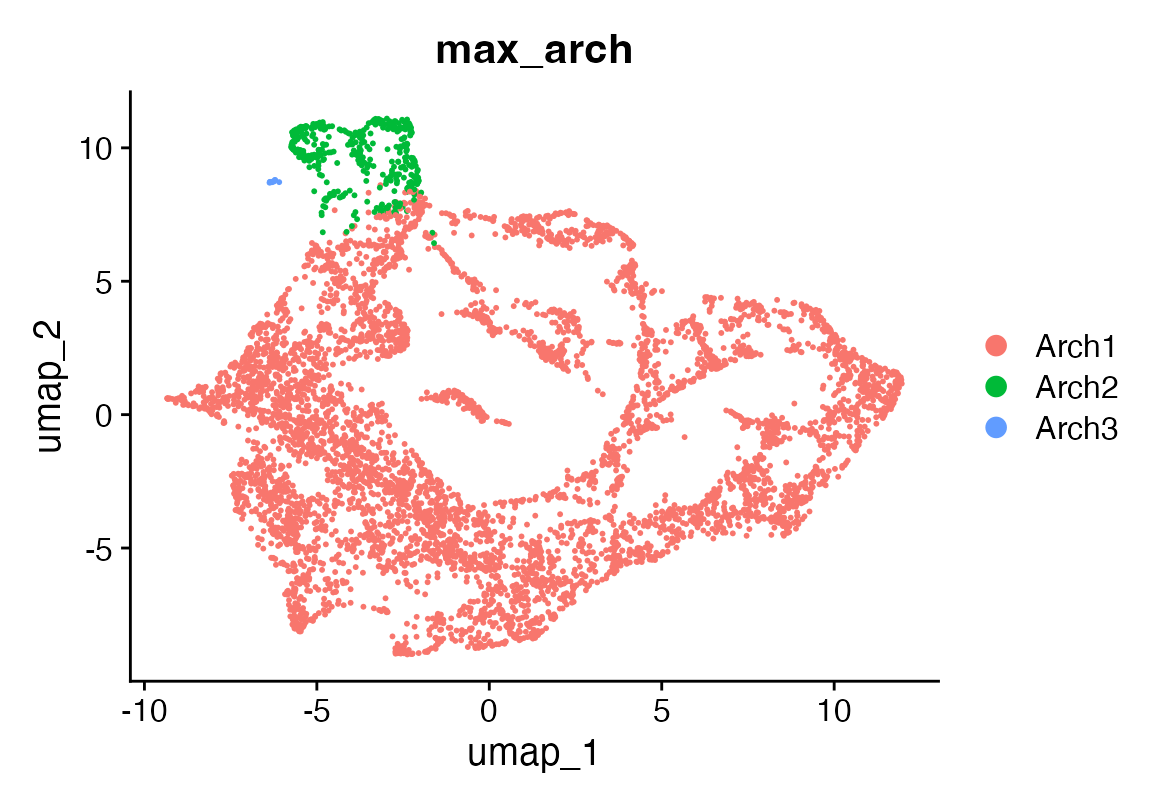
S_df <- as.data.frame(t(res$S))
colnames(S_df) <- paste0("Arch", seq_len(ncol(S_df)))

# 2) pick your “specialist” threshold
specialist_thresh <- 0.95


# 3) for each cell, find if its max-weight > threshold; if so, label by archetype
max_w   <- apply(S_df, 1, max)
best_k  <- apply(S_df, 1, which.max)
specialist_label <- ifelse(max_w > specialist_thresh,
                           paste0("Arch", best_k),
                           NA_character_)

# 4) add to Seurat
seu$specialist <- specialist_label


p <- DimPlot(seu, reduction = "umap", group.by = "specialist")
p + scale_colour_discrete(na.value = "lightgrey")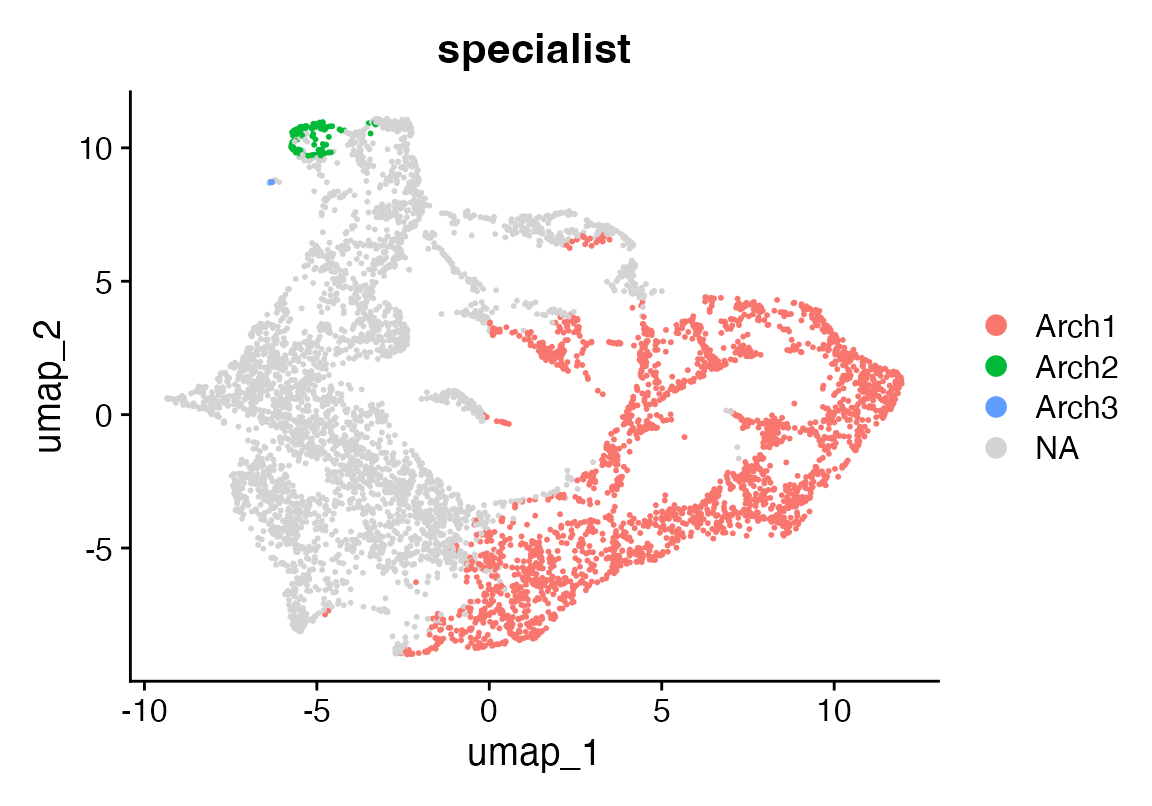
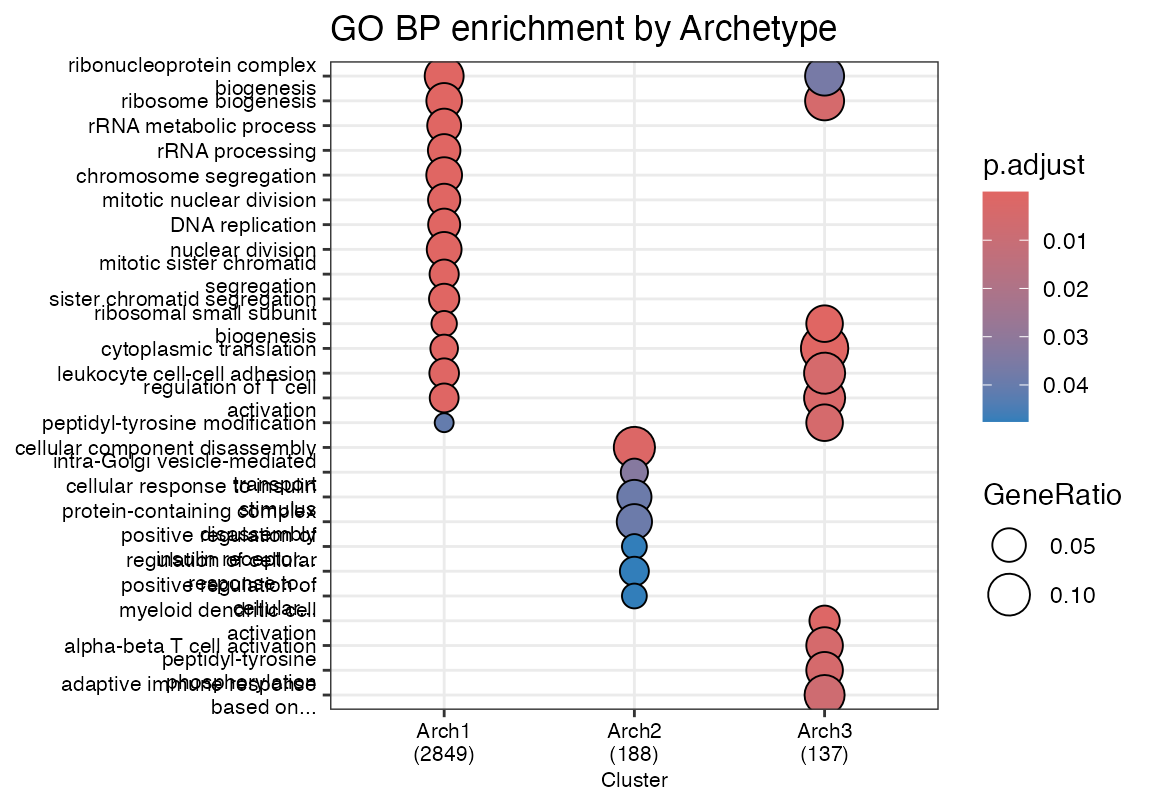
Pathway analysis of archetype specialists
suppressPackageStartupMessages({library(dplyr)
library(purrr)
library(clusterProfiler)
library(org.Hs.eg.db)})

DefaultAssay(seu)<- "RNA"
seu_spec <-seu[,!is.na(seu$specialist)]
# 1) For each archetype, find a “marker gene list” (here: top 200 avg. expr)
marker_genes <- FindAllMarkers(seu_spec, group.by = "specialist", )
marker_genes$diff <- abs(marker_genes$pct.1 - marker_genes$pct.2)

marker_genes_filt <- marker_genes[marker_genes$p_val_adj<5e-2 & abs(marker_genes$avg_log2FC) > 1 & marker_genes$diff>0.1,]

marker_genes_filt <- marker_genes_filt[!duplicated(marker_genes_filt$gene),]

ccr <- compareCluster(
  gene ~ cluster,
  data         = marker_genes_filt,
  fun          = "enrichGO",
  OrgDb        = org.Hs.eg.db,
  keyType      = "SYMBOL",
  ont          = "BP",
  pAdjustMethod= "BH",
  pvalueCutoff = 0.05,
  qvalueCutoff = 0.05,
  readable     = TRUE
)

# fix length of terms...
shorten_terms <- function(terms, max_words = Inf, max_chars = Inf) {
  sapply(terms, function(term) {
    words <- strsplit(term, "\\s+")[[1]]
    truncated <- term
    did_trunc <- FALSE

    if (!is.infinite(max_words) && length(words) > max_words) {
      truncated <- paste(words[1:max_words], collapse = " ")
      did_trunc <- TRUE
    }

    if (!is.infinite(max_chars) && nchar(truncated) > max_chars) {
      cut_sub <- substr(truncated, 1, max_chars)
      spaces <- gregexpr("\\s+", cut_sub)[[1]]
      if (all(spaces == -1)) {
        truncated <- cut_sub
      } else {
        last_space <- tail(spaces, 1)
        truncated <- substr(cut_sub, 1, last_space - 1)
      }
      did_trunc <- TRUE
    }

    if (did_trunc) truncated <- paste0(truncated, "...")
    truncated
  }, USE.NAMES = FALSE)
}

ccr@compareClusterResult$Description <- shorten_terms(ccr@compareClusterResult$Description, max_chars = 40)

dotplot(ccr, showCategory=10, font.size = 8) + ggtitle("GO BP enrichment by Archetype")