How to use UMAP transform on a single cell dataset (Seurat) using Seurat Workflow
2024-09-26
ProjectDataSeuratWorkflow.RmdNote that this code was inspired by and adapted from:
Installing flscuts
First, ensure you have the devtools R package installed,
which allows you to install packages from GitHub. If
devtools is installed, you can easily install using the
following command:
devtools::install_github("furlan-lab/flscuts")Loading data
In this section, we’ll load two Seurat objects, fix the celltypes so they harmonize, and create some colors.
# Load required packages
suppressPackageStartupMessages({
  library(flscuts)
    library(Seurat)
  library(monocle3)
  library(viewmastR)
  library(ggplot2)
  library(scCustomize)
  library(tidyr)
})
Load reference dataset, run Seurat workflow, and make some colors
seur <- readRDS(file.path(ROOT_DIR1, "240926_final_object.RDS"))
# Make some colors
cols1 <- as.character(pals::polychrome()[c(1,3:13)])

seur <- NormalizeData(seur) %>% FindVariableFeatures() %>% ScaleData() %>% RunPCA() %>% RunUMAP(dims=1:30, return.model = T)
DimPlot_scCustom(seur, group.by = "celltype", colors_use = cols1)+theme_void()+ggtitle("Reference")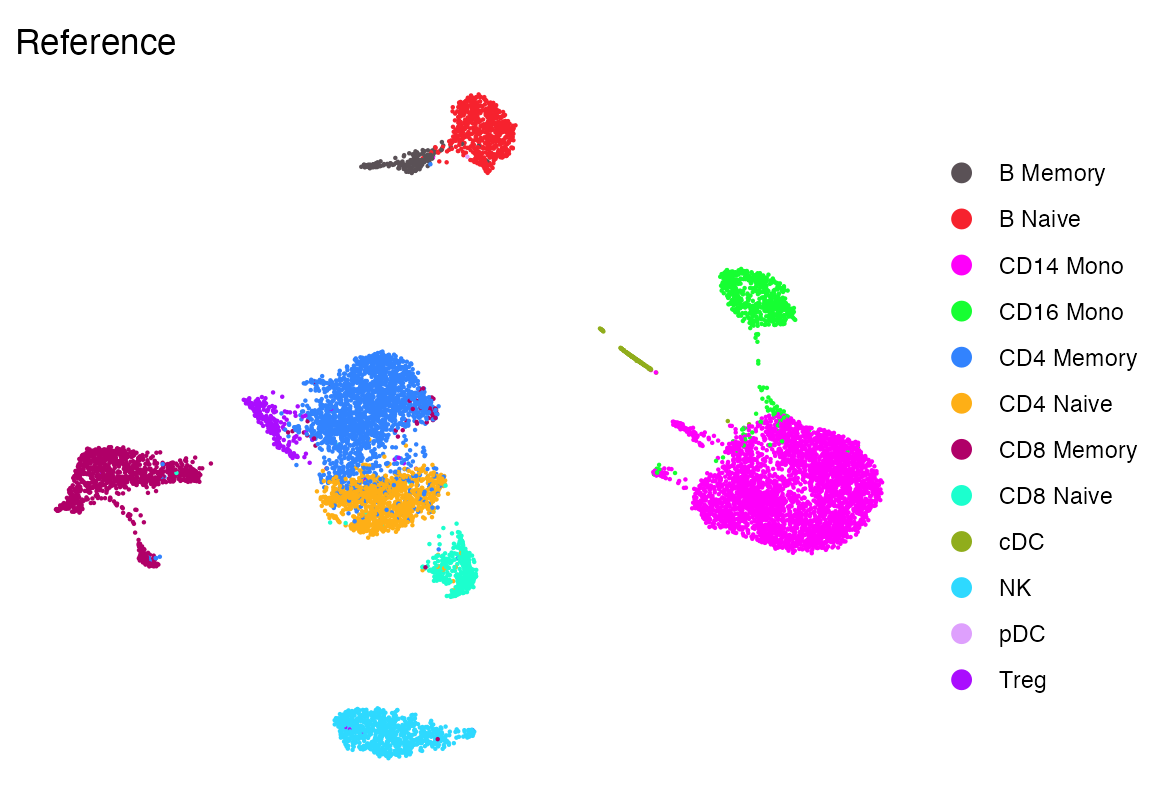
Load query dataset, run Seurat workflow
seu <-readRDS(file.path(ROOT_DIR3, "240926_5p_seu.RDS"))
seu <- NormalizeData(seu) %>% FindVariableFeatures() %>% ScaleData() %>% RunPCA() %>% RunUMAP(dims=1:30, return.model = T)
DimPlot_scCustom(seu, group.by = "celltype", colors_use = cols1)+theme_void()+ggtitle("Query")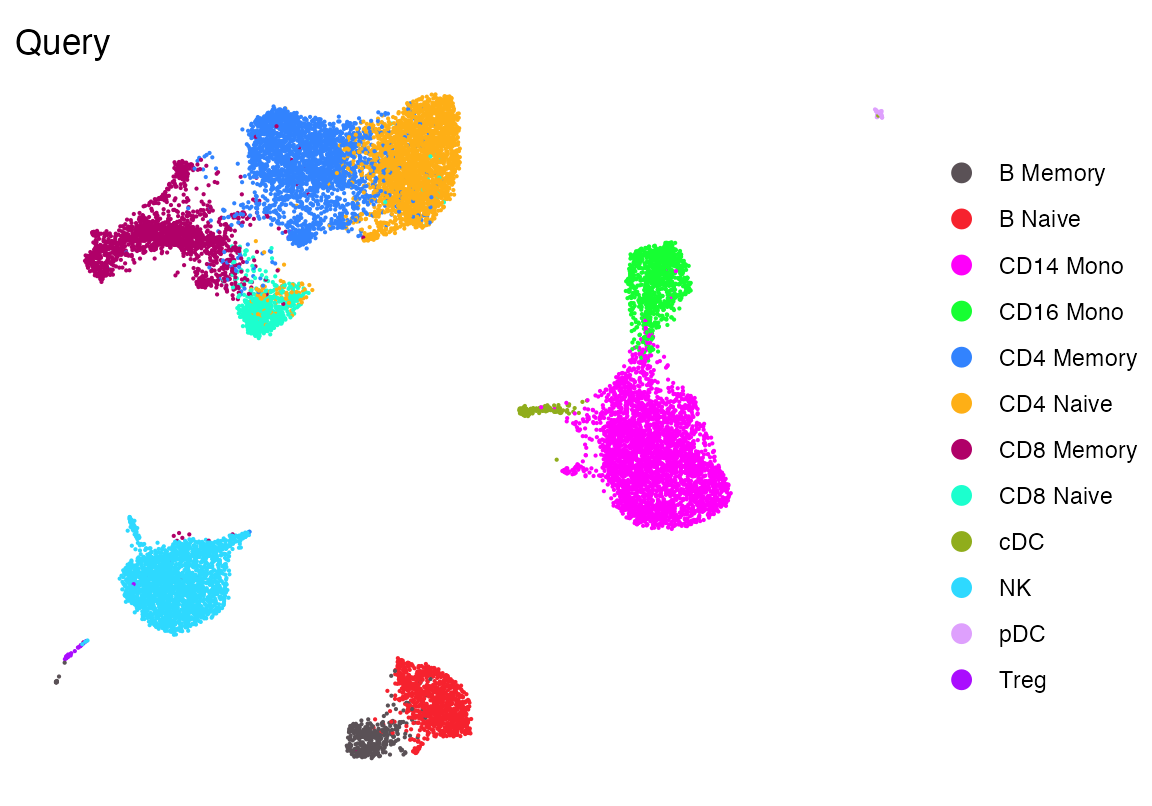
Make sure labels are correct
In this code, we show that the labels given to the reference and query cells are correct.
First the reference
Idents(seur) <- seur$celltype
all_markers <- FindAllMarkers(object = seur) %>%
    Add_Pct_Diff() %>% dplyr::filter(pct_diff > 0.6)


top_markers <- Extract_Top_Markers(marker_dataframe = all_markers, num_genes = 5, named_vector = FALSE,
    make_unique = TRUE)

Clustered_DotPlot(seurat_object = seur, features = top_markers, colors_use_idents = cols1, k=11, plot_km_elbow = F)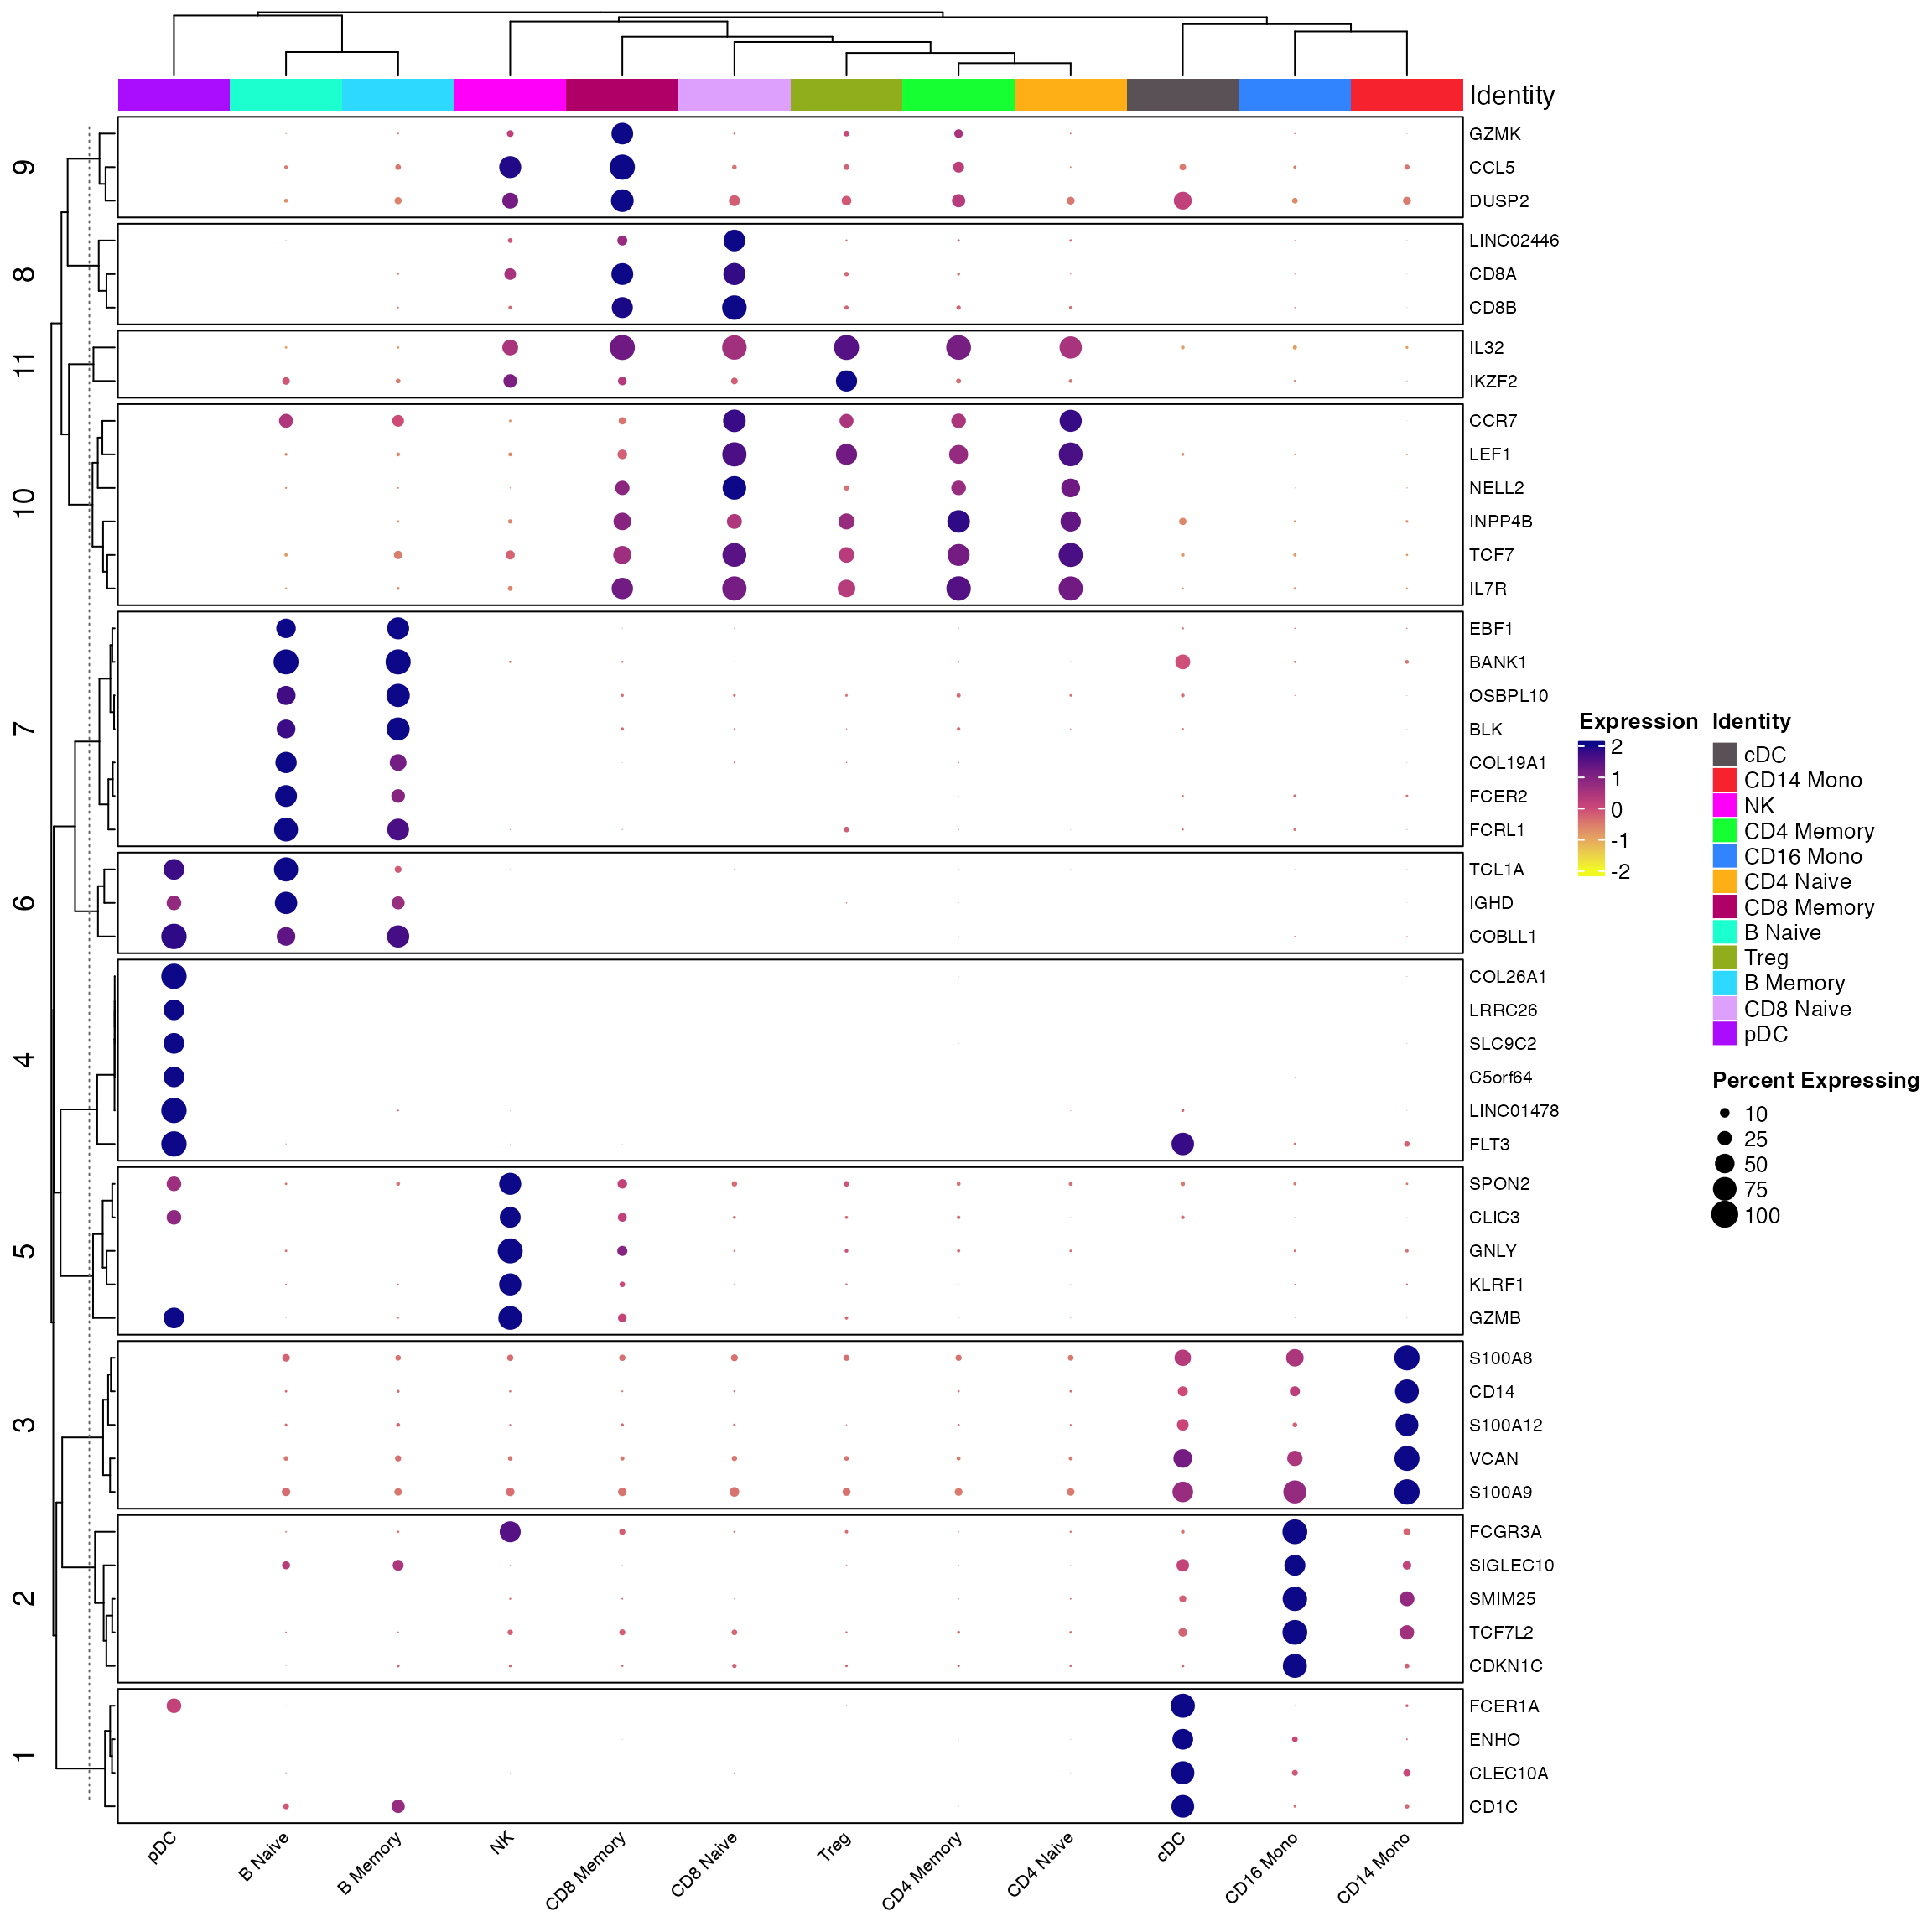
And the query
Idents(seu) <- seu$celltype
all_markers <- FindAllMarkers(object = seu) %>%
    Add_Pct_Diff() %>% dplyr::filter(pct_diff > 0.6)


top_markers <- Extract_Top_Markers(marker_dataframe = all_markers, num_genes = 5, named_vector = FALSE,
    make_unique = TRUE)

Clustered_DotPlot(seurat_object = seur, features = top_markers, colors_use_idents = cols1, k=11, plot_km_elbow = F)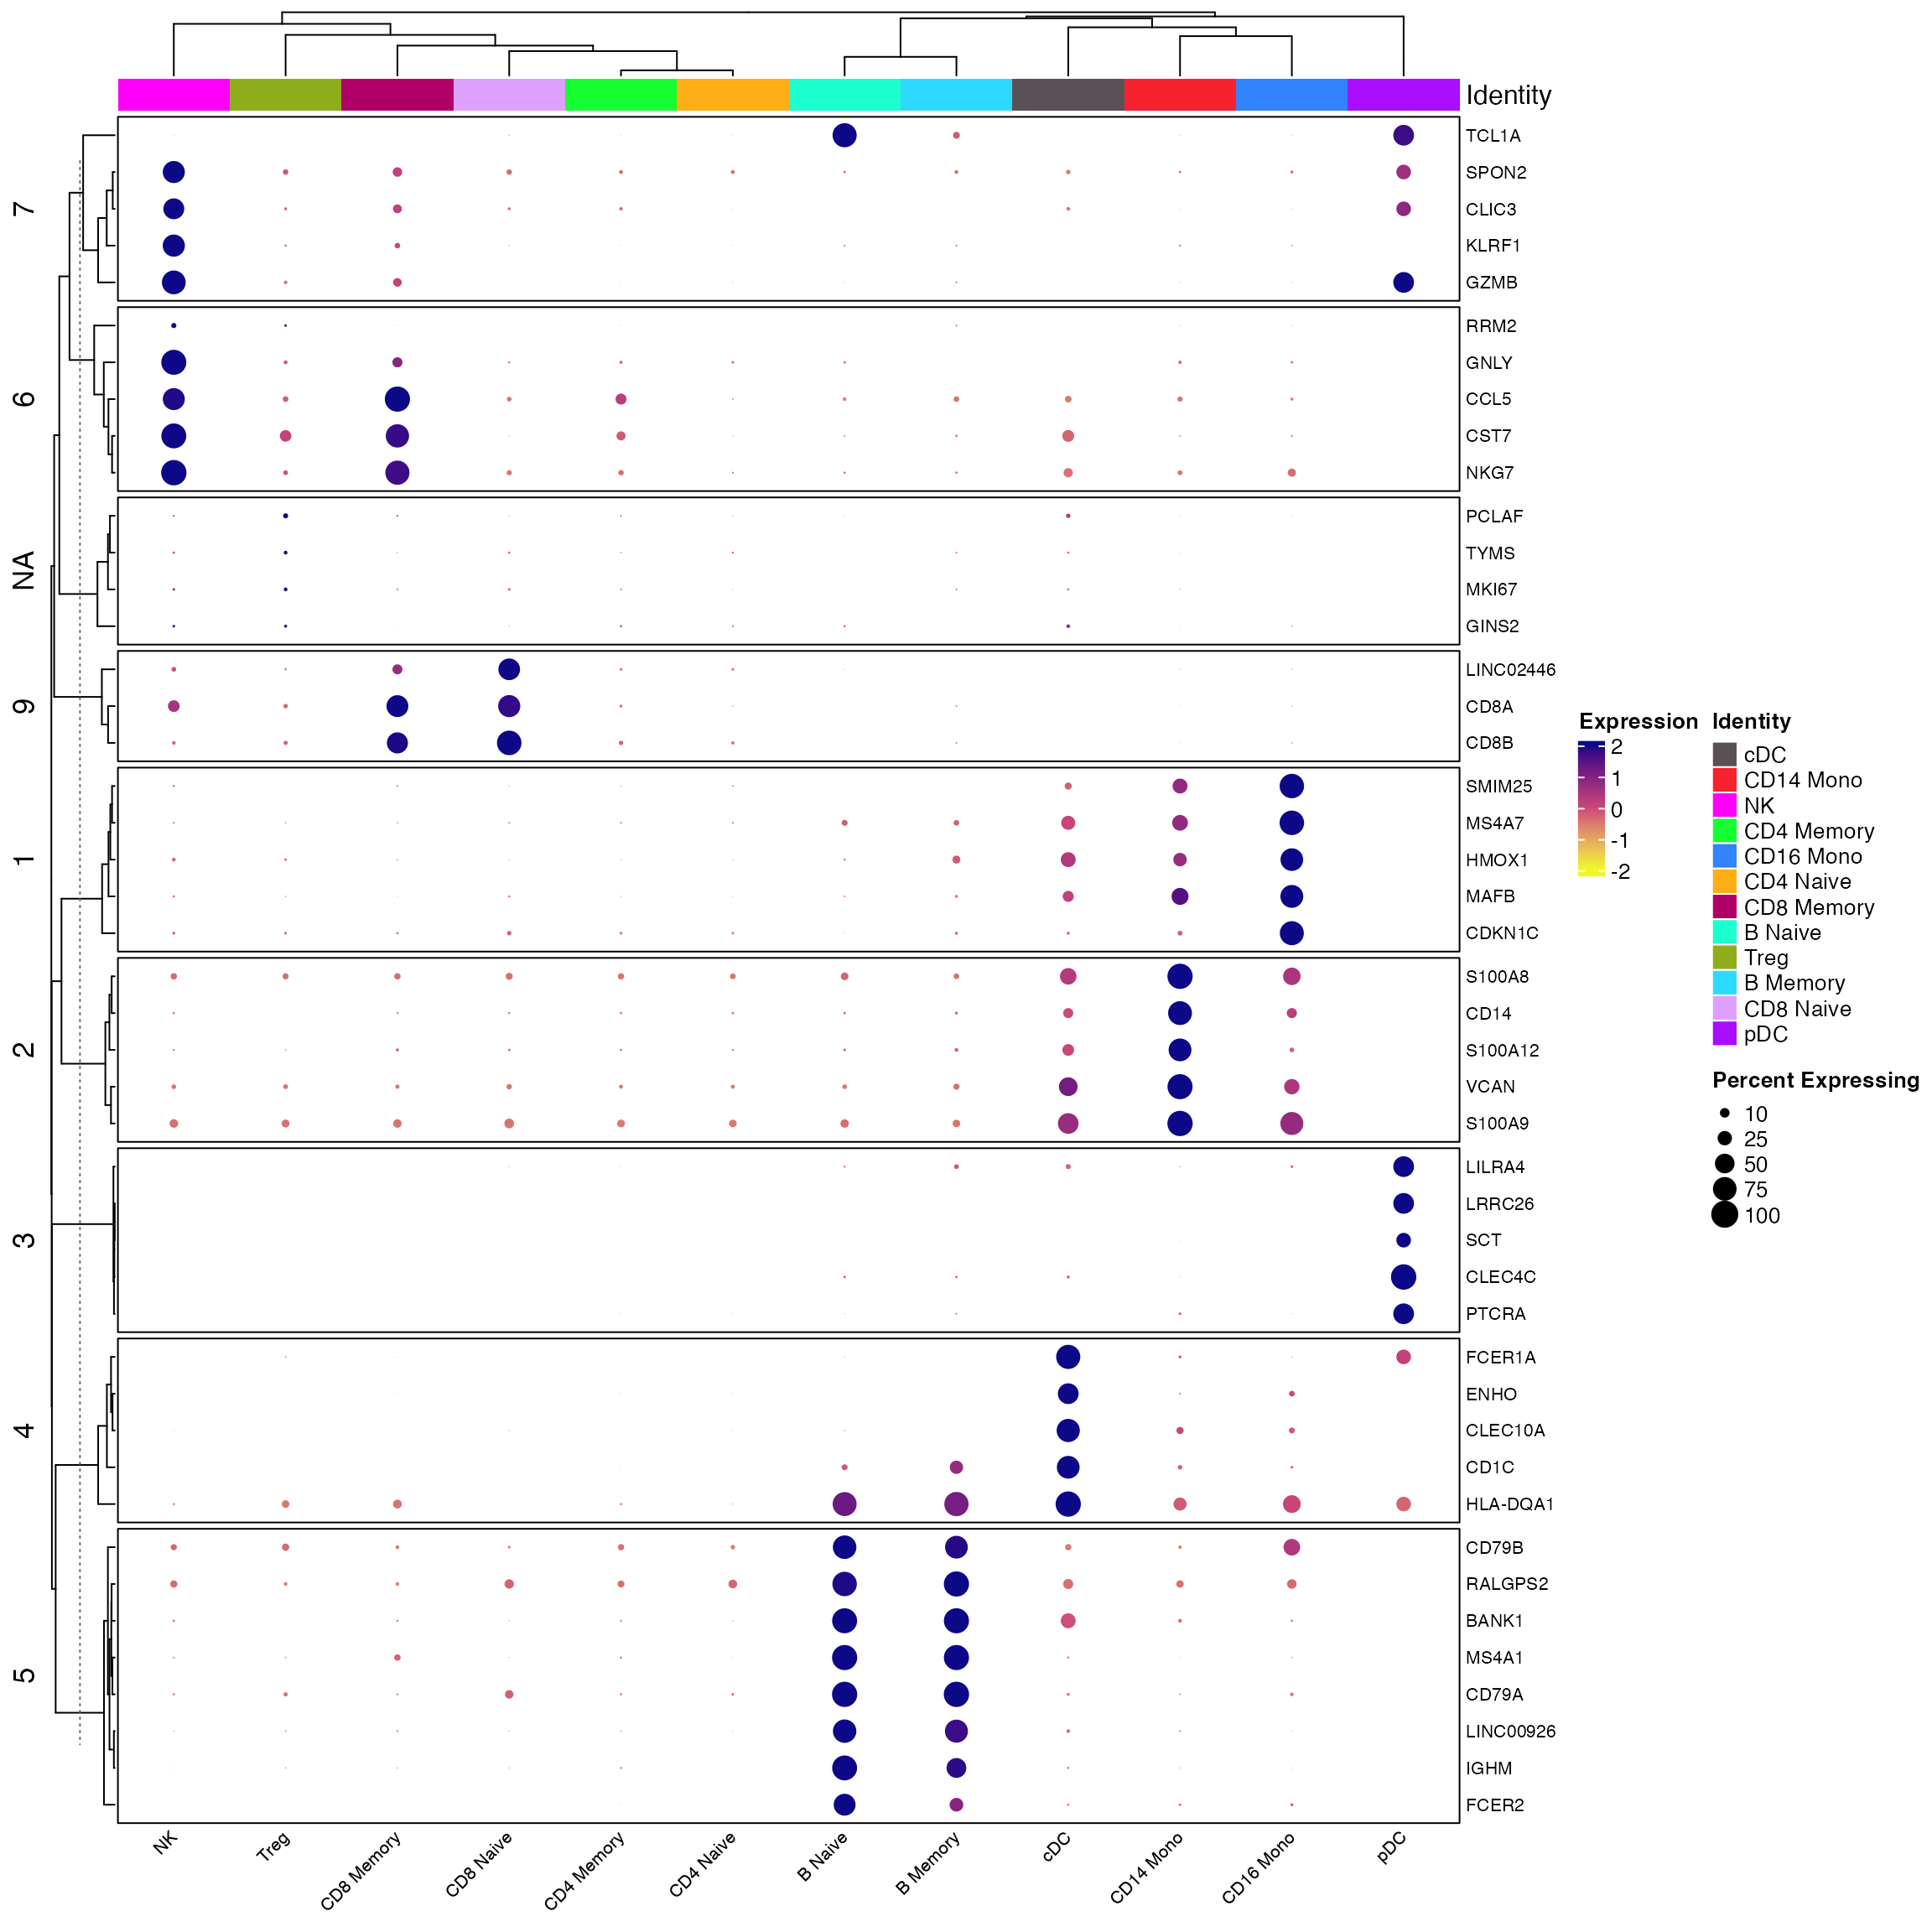
Find Transfer Anchors
anchors <- FindTransferAnchors(
    reference = seur,
    query = seu,
    reference.reduction = 'pca',
    features = rownames(x = seur[["pca"]]@feature.loadings),
    dims = 1:30,
    nn.method = "annoy",
    k.filter = NA,
    verbose = TRUE
  )
Map using anchors
seu.1 <- MapQuery(
    reference = seur,
    query = seu,
    anchorset = anchors,
    refdata = list(celltype = "celltype"),
    reference.reduction = "pca",
    reduction.model = "umap"
  )

p0 <- DimPlot_scCustom(seur, group.by = "celltype", label = T, colors_use = cols1) +theme_void()+ggtitle("Reference - aka Projector Dataset")
p1 <- DimPlot_scCustom(seu.1, reduction = "ref.umap",group.by = "predicted.celltype", label = T, colors_use = cols1) + NoLegend() +theme_void()+ggtitle("Query - Mapped using UMAP Projection from Reference")
p0+p1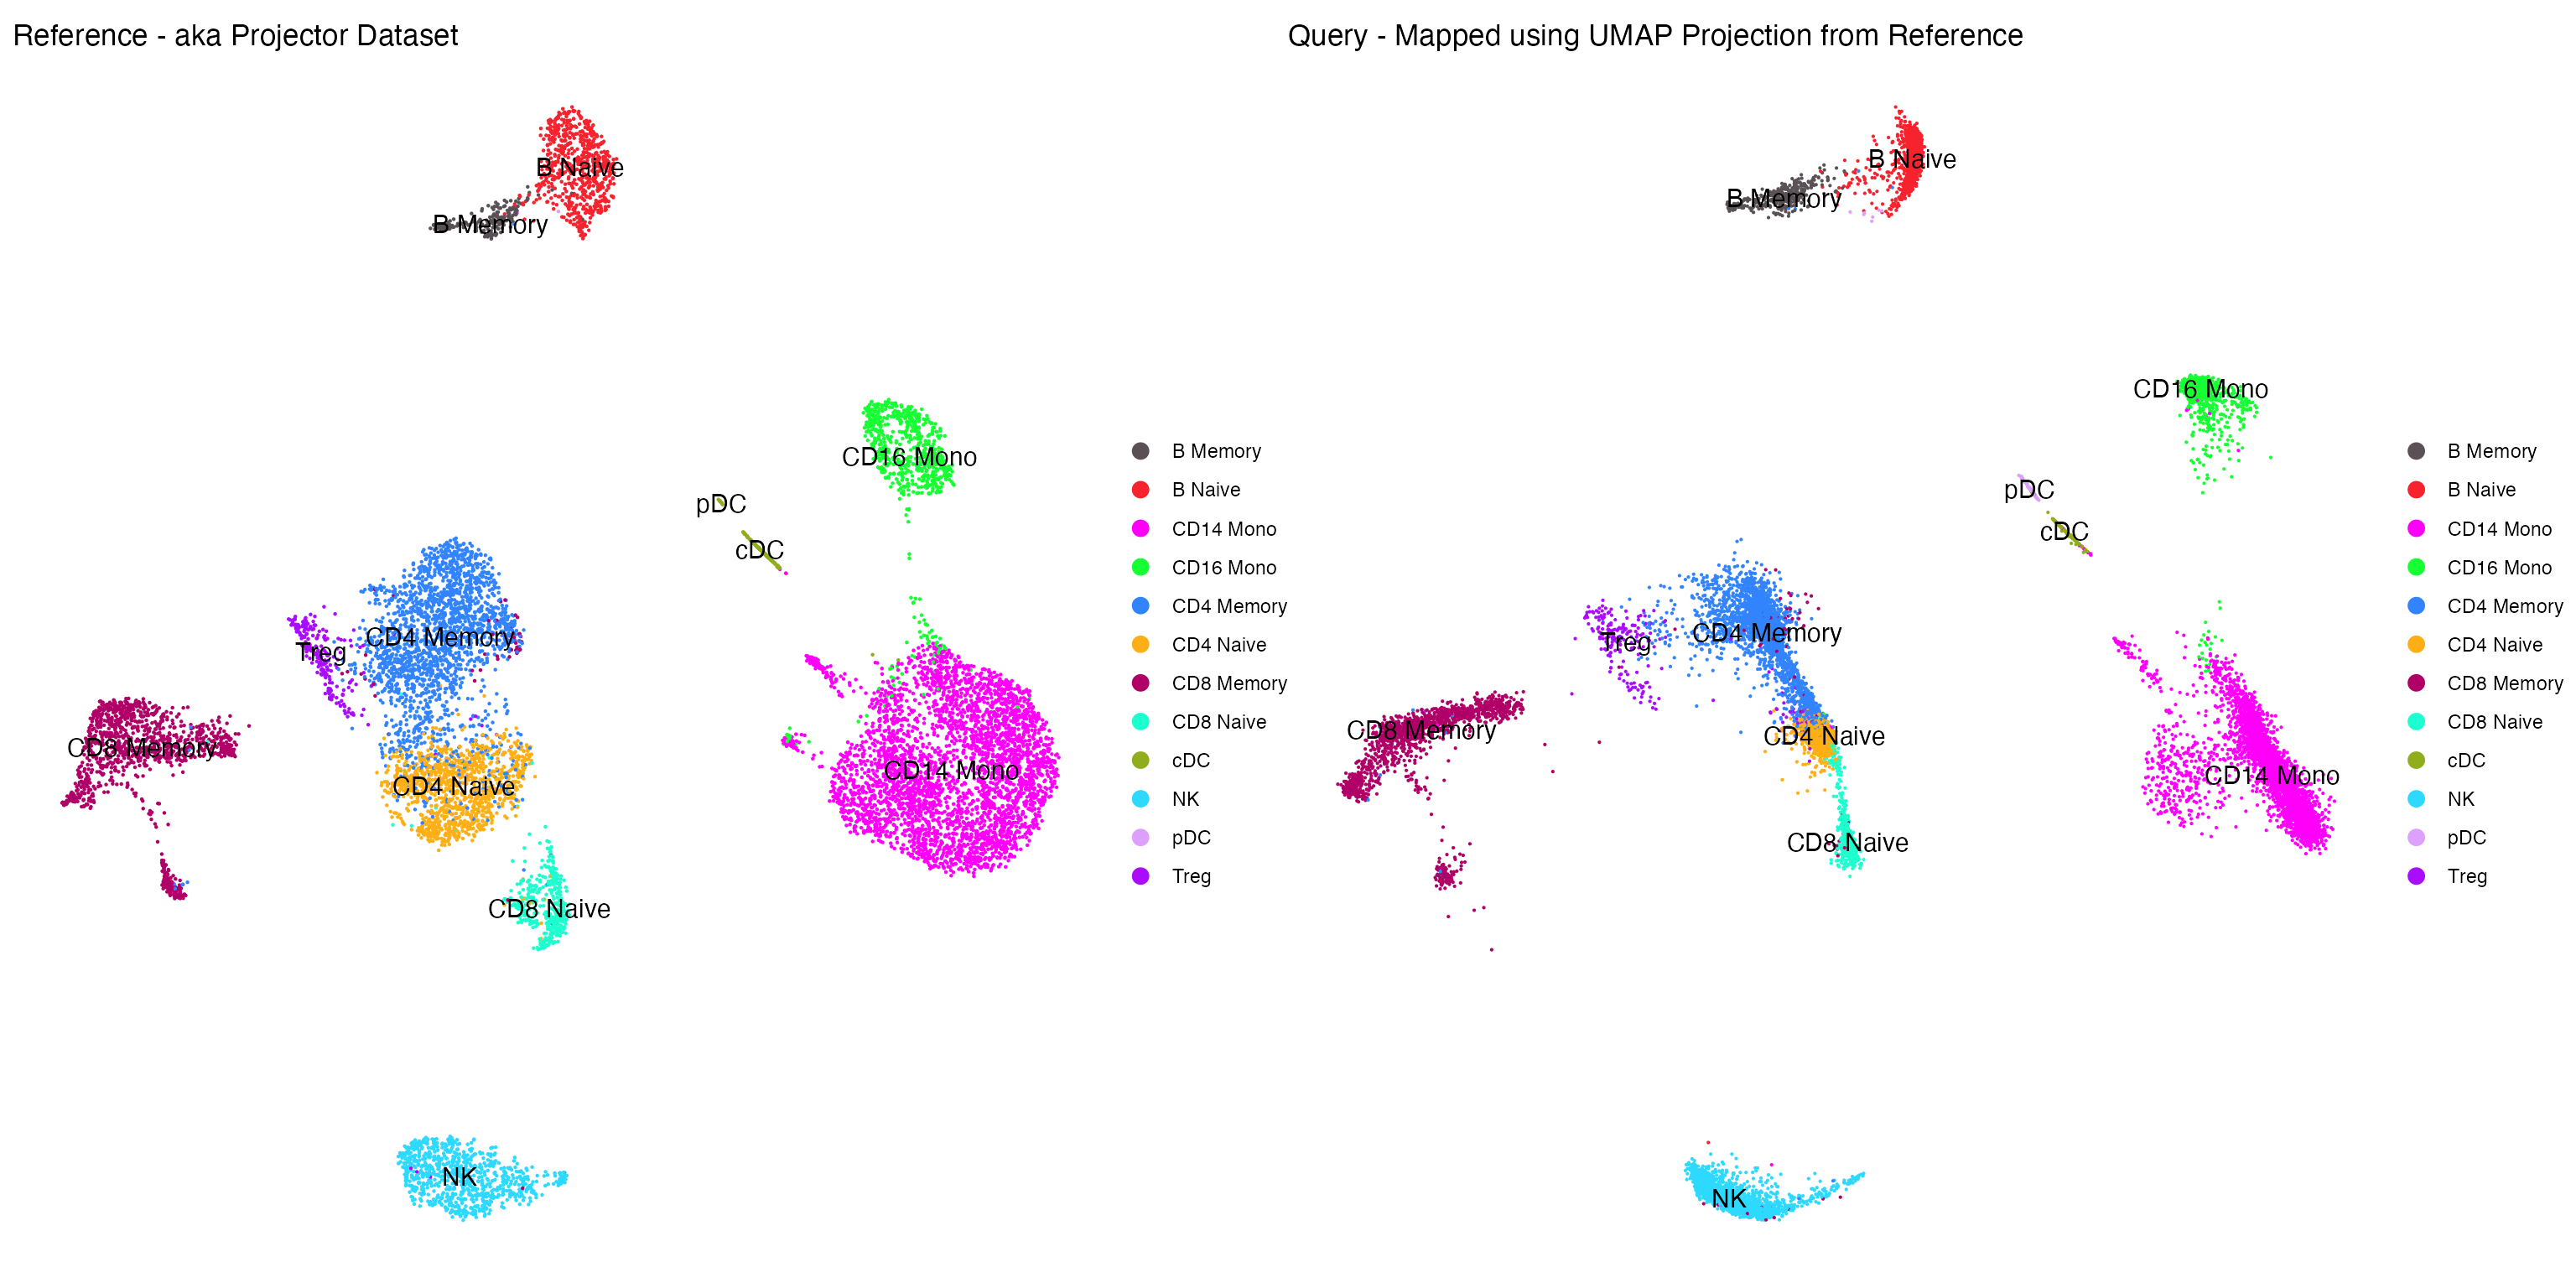
Alter parameters of UMAP model and redo projection
If you would like to alter the umap parameters you may do so as follows, then redo the projection.
# set embeddings
seur[["umap.new"]] <- CreateDimReducObject(embeddings = seur[["umap"]]@cell.embeddings, key = "UMAPnew_", assay = "RNA")

# set UMAP models
umap.new.model <- list()
umap.new.model$n_epochs <- 1000
umap.new.model$alpha <-1
umap.new.model$method <- "umap"
umap.new.model$negative_sample_rate <- 5
umap.new.model$gamma <- 1
umap.new.model$approx_pow <- 0
umap.new.model$n_neighbors <- 10
umap.new.model$metric$cosine <- list()
umap.new.model$embedding <- seur[["umap.new"]]@cell.embeddings
ab_param <- uwot:::find_ab_params(spread = 1, min_dist = 0.3)
umap.new.model$a <- ab_param["a"]
umap.new.model$b <- ab_param["b"]
seur[["umap.new"]]@misc$model <- umap.new.model


seu.2 <- MapQuery(
  reference = seur,
  query = seu,
  anchorset = anchors,
  refdata = list(celltype = "celltype"),
  reference.reduction = "pca",
  reduction.model = "umap.new"
)


p2 <- DimPlot_scCustom(seu.2, reduction = "ref.umap",group.by = "predicted.celltype", label = T, colors_use = cols1) + NoLegend() +theme_void()+ggtitle("Query - Mapped using Altered UMAP Projection from Reference")

p0+p2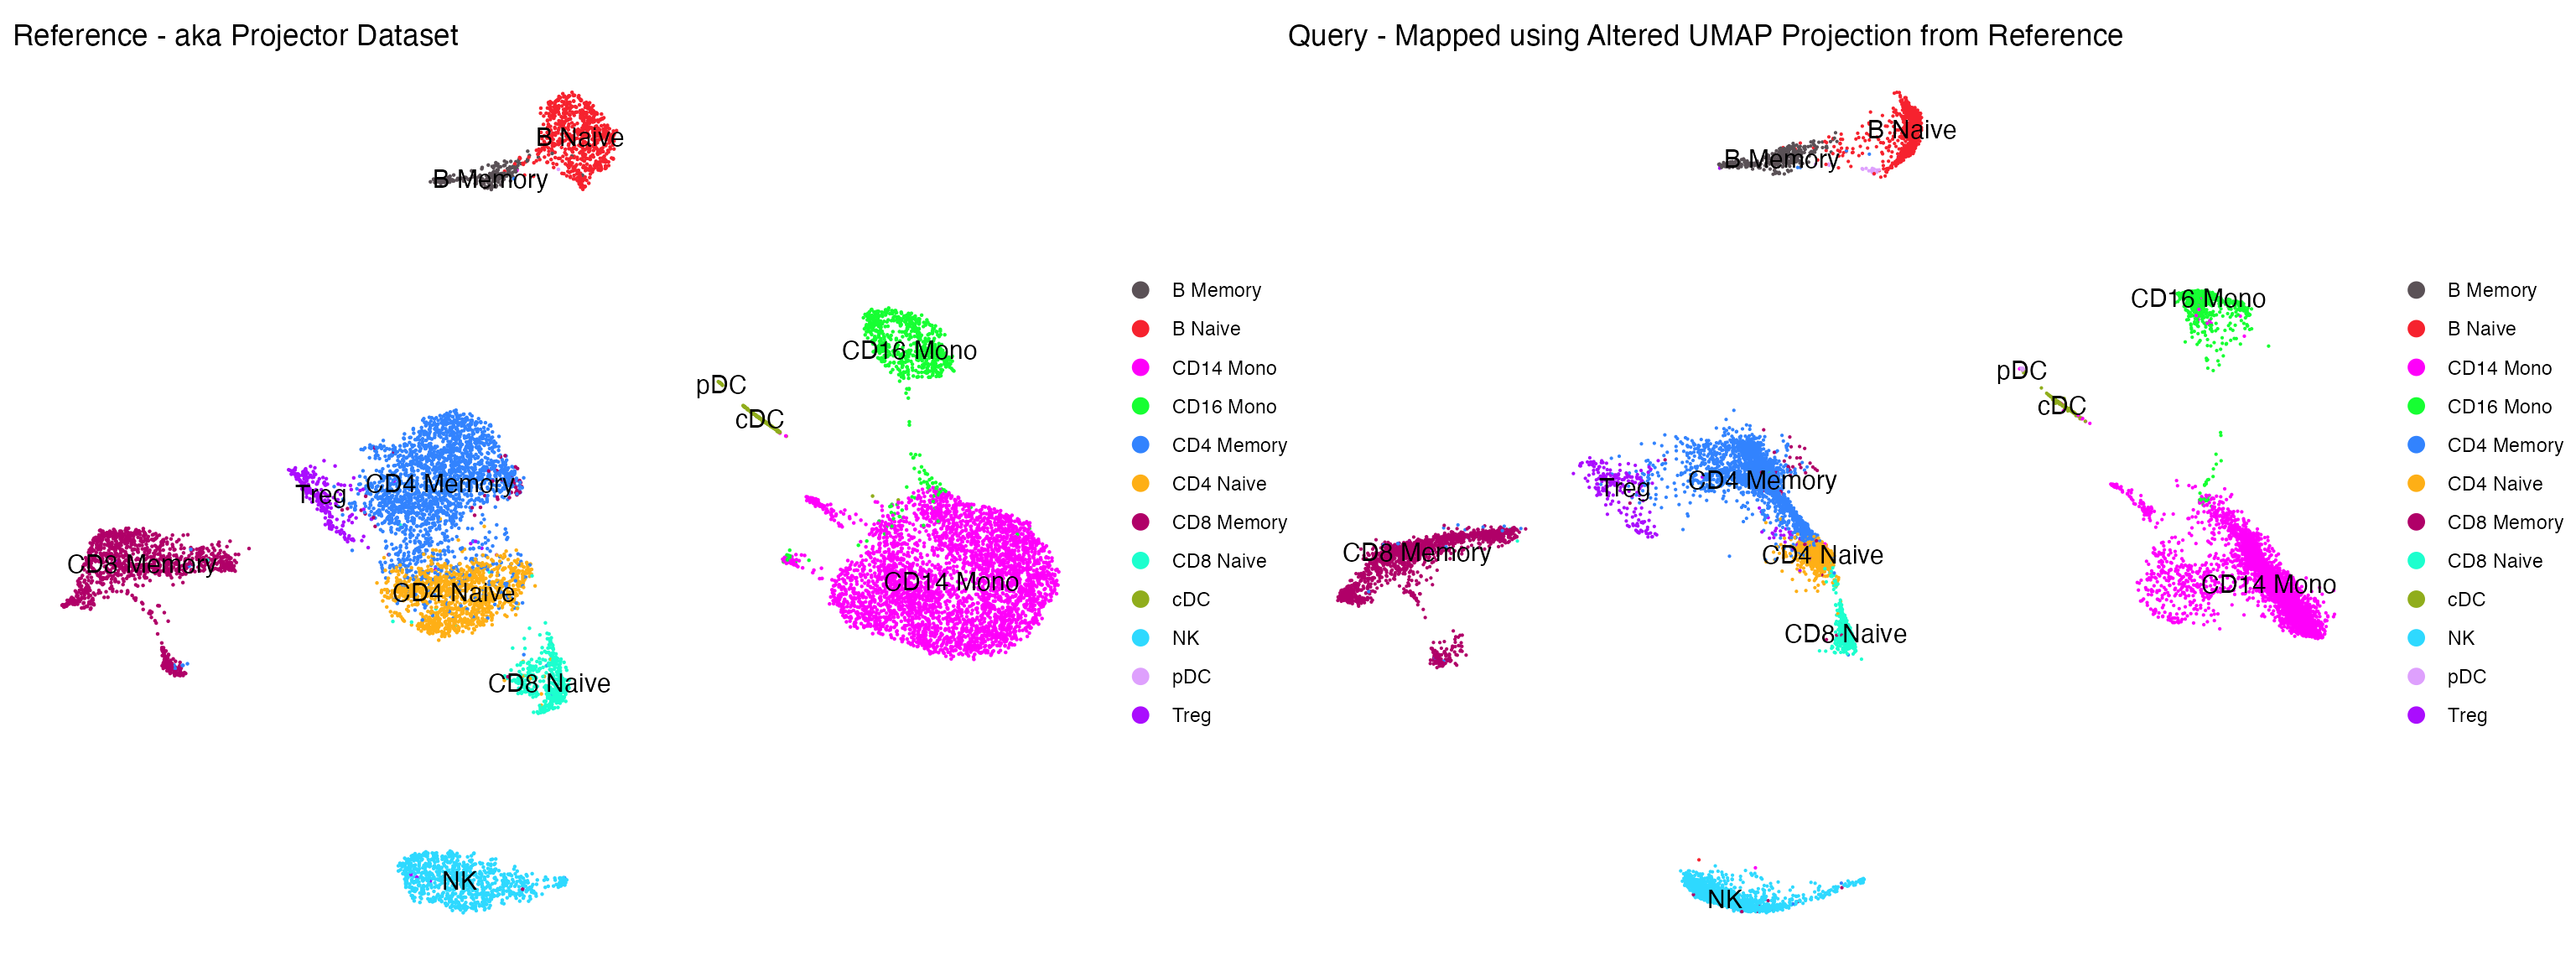
Appendix
## R version 4.3.1 (2023-06-16)
## Platform: x86_64-apple-darwin20 (64-bit)
## Running under: macOS Sonoma 14.6.1
##
## Matrix products: default
## BLAS:   /Library/Frameworks/R.framework/Versions/4.3-x86_64/Resources/lib/libRblas.0.dylib
## LAPACK: /Library/Frameworks/R.framework/Versions/4.3-x86_64/Resources/lib/libRlapack.dylib;  LAPACK version 3.11.0
##
## locale:
## [1] en_US.UTF-8/en_US.UTF-8/en_US.UTF-8/C/en_US.UTF-8/en_US.UTF-8
##
## time zone: America/Los_Angeles
## tzcode source: internal
##
## attached base packages:
## [1] stats4    stats     graphics  grDevices utils     datasets  methods
## [8] base
##
## other attached packages:
##  [1] tidyr_1.3.1                 scCustomize_2.1.2
##  [3] ggplot2_3.5.0               viewmastR_0.2.3
##  [5] monocle3_1.4.3              SingleCellExperiment_1.22.0
##  [7] SummarizedExperiment_1.30.2 GenomicRanges_1.52.1
##  [9] GenomeInfoDb_1.41.1         IRanges_2.34.1
## [11] S4Vectors_0.38.2            MatrixGenerics_1.12.3
## [13] matrixStats_1.2.0           Biobase_2.60.0
## [15] BiocGenerics_0.46.0         Seurat_5.0.3
## [17] SeuratObject_5.0.1          sp_2.1-3
## [19] flscuts_0.1.1
##
## loaded via a namespace (and not attached):
##   [1] fs_1.6.3                  spatstat.sparse_3.0-3
##   [3] bitops_1.0-7              lubridate_1.9.3
##   [5] RcppMsgPack_0.2.3         httr_1.4.7
##   [7] RColorBrewer_1.1-3        doParallel_1.0.17
##   [9] backports_1.4.1           tools_4.3.1
##  [11] sctransform_0.4.1         utf8_1.2.4
##  [13] R6_2.5.1                  lazyeval_0.2.2
##  [15] uwot_0.1.16               GetoptLong_1.0.5
##  [17] withr_3.0.0               gridExtra_2.3
##  [19] progressr_0.14.0          cli_3.6.2
##  [21] textshaping_0.3.7         Cairo_1.6-2
##  [23] spatstat.explore_3.2-6    fastDummies_1.7.3
##  [25] labeling_0.4.3            sass_0.4.9
##  [27] spatstat.data_3.0-4       ggridges_0.5.6
##  [29] pbapply_1.7-2             pkgdown_2.0.7
##  [31] systemfonts_1.0.6         foreign_0.8-86
##  [33] R.utils_2.12.3            dichromat_2.0-0.1
##  [35] parallelly_1.37.1         maps_3.4.2
##  [37] limma_3.56.2              pals_1.8
##  [39] rstudioapi_0.15.0         generics_0.1.3
##  [41] shape_1.4.6.1             gtools_3.9.5
##  [43] ica_1.0-3                 spatstat.random_3.2-3
##  [45] dplyr_1.1.4               Matrix_1.6-5
##  [47] ggbeeswarm_0.7.2          fansi_1.0.6
##  [49] abind_1.4-5               R.methodsS3_1.8.2
##  [51] lifecycle_1.0.4           yaml_2.3.8
##  [53] edgeR_3.42.4              snakecase_0.11.1
##  [55] recipes_1.0.10            Rtsne_0.17
##  [57] paletteer_1.6.0           grid_4.3.1
##  [59] promises_1.2.1            crayon_1.5.2
##  [61] miniUI_0.1.1.1            lattice_0.22-5
##  [63] beachmat_2.16.0           cowplot_1.1.3
##  [65] mapproj_1.2.11            pillar_1.9.0
##  [67] knitr_1.45                ComplexHeatmap_2.16.0
##  [69] rjson_0.2.21              boot_1.3-28.1
##  [71] future.apply_1.11.1       codetools_0.2-19
##  [73] leiden_0.4.3.1            glue_1.7.0
##  [75] data.table_1.15.2         vctrs_0.6.5
##  [77] png_0.1-8                 spam_2.10-0
##  [79] gtable_0.3.4              rematch2_2.1.2
##  [81] assertthat_0.2.1          cachem_1.0.8
##  [83] gower_1.0.1               xfun_0.42
##  [85] prodlim_2023.08.28        S4Arrays_1.2.0
##  [87] mime_0.12                 tidygraph_1.3.1
##  [89] survival_3.5-7            timeDate_4032.109
##  [91] pbmcapply_1.5.1           iterators_1.0.14
##  [93] hardhat_1.3.1             lava_1.8.0
##  [95] ellipsis_0.3.2            fitdistrplus_1.1-11
##  [97] ipred_0.9-14              ROCR_1.0-11
##  [99] nlme_3.1-164              bit64_4.0.5
## [101] RcppAnnoy_0.0.22          bslib_0.6.1
## [103] irlba_2.3.5.1             rpart_4.1.23
## [105] vipor_0.4.7               KernSmooth_2.23-22
## [107] colorspace_2.1-0          Hmisc_5.1-2
## [109] nnet_7.3-19               ggrastr_1.0.2
## [111] tidyselect_1.2.1          bit_4.0.5
## [113] compiler_4.3.1            htmlTable_2.4.2
## [115] BiocNeighbors_1.18.0      hdf5r_1.3.11
## [117] desc_1.4.3                DelayedArray_0.26.7
## [119] plotly_4.10.4             checkmate_2.3.1
## [121] scales_1.3.0              lmtest_0.9-40
## [123] stringr_1.5.1             digest_0.6.35
## [125] goftest_1.2-3             presto_1.0.0
## [127] spatstat.utils_3.1-0      minqa_1.2.6
## [129] rmarkdown_2.26            XVector_0.40.0
## [131] htmltools_0.5.7           pkgconfig_2.0.3
## [133] base64enc_0.1-3           lme4_1.1-35.1
## [135] sparseMatrixStats_1.12.2  highr_0.10
## [137] fastmap_1.1.1             rlang_1.1.3
## [139] GlobalOptions_0.1.2       htmlwidgets_1.6.4
## [141] UCSC.utils_1.1.0          shiny_1.8.0
## [143] DelayedMatrixStats_1.22.6 farver_2.1.1
## [145] jquerylib_0.1.4           zoo_1.8-12
## [147] jsonlite_1.8.8            BiocParallel_1.34.2
## [149] ModelMetrics_1.2.2.2      R.oo_1.26.0
## [151] BiocSingular_1.16.0       RCurl_1.98-1.14
## [153] magrittr_2.0.3            Formula_1.2-5
## [155] GenomeInfoDbData_1.2.10   dotCall64_1.1-1
## [157] patchwork_1.2.0           munsell_0.5.0
## [159] Rcpp_1.0.12               viridis_0.6.5
## [161] reticulate_1.35.0         pROC_1.18.5
## [163] stringi_1.8.3             miloR_1.8.1
## [165] ggraph_2.2.1              zlibbioc_1.46.0
## [167] MASS_7.3-60.0.1           plyr_1.8.9
## [169] parallel_4.3.1            listenv_0.9.1
## [171] ggrepel_0.9.5             forcats_1.0.0
## [173] deldir_2.0-4              graphlayouts_1.1.0
## [175] splines_4.3.1             tensor_1.5
## [177] circlize_0.4.16           locfit_1.5-9.8
## [179] igraph_2.0.3              spatstat.geom_3.2-9
## [181] RcppHNSW_0.6.0            reshape2_1.4.4
## [183] ScaledMatrix_1.8.1        evaluate_0.23
## [185] ggprism_1.0.4             nloptr_2.0.3
## [187] foreach_1.5.2             tweenr_2.0.3
## [189] httpuv_1.6.14             RANN_2.6.1
## [191] purrr_1.0.2               polyclip_1.10-6
## [193] future_1.33.1             clue_0.3-65
## [195] scattermore_1.2           ggforce_0.4.2
## [197] janitor_2.2.0             rsvd_1.0.5
## [199] xtable_1.8-4              RSpectra_0.16-1
## [201] later_1.3.2               class_7.3-22
## [203] viridisLite_0.4.2         ragg_1.3.0
## [205] tibble_3.2.1              memoise_2.0.1
## [207] beeswarm_0.4.0            cluster_2.1.6
## [209] timechange_0.3.0          globals_0.16.3
## [211] caret_6.0-94
getwd()## [1] "/Users/sfurlan/develop/flscuts/vignettes"